Category Archives: Uncategorized

TIN, Voronoi, and Delaunay

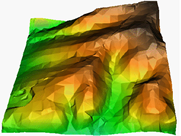
One of the most useful methods for modelling surfaces is with a triangular irregular network, or TIN. One aspect of TIN that makes it preferable to a raster grid is that you can put the points anywhere that you want. This means that you can make the points more dense where there is more detail, and more sparse where there is little detail. The surface at the right is actually composed of these irregular triangles.
TIN surface
But not all TINs are created equal. The best TIN is the one that maximizes the angles of the triangles; that is, it produces 'fat' triangles rather than 'skinny' triangles. This is because the further away a node of a triangle is from the rest of the triangle (which happens with skinny triangles), the less likely that the point is the same as the rest of the triangle. The First Law of Geography is: "Everything is related to everything else, but near things are more related than distant things."
The way to make these fat triangles is through fulfilling the Delaunay criterion. This criterion states that no point of a triangle can be inside the circumcircle of another triangle. For example, consider the four points to the right.Four points in space
Their circumcircles appear as shown.Delaunay circumcircles
Now if you were to make triangles from these points, note that none of the points enters into the circumcircle of the other triangle. They may be on the border of the circumcircle, but they do not enter it.Delaunay triangles
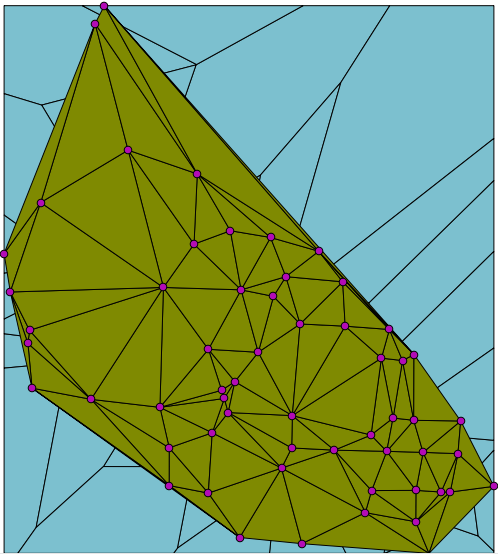
To make a TIN with these “fat” triangles, start by making Voronoi polygons. These are polygons around each point in your space. The borders represent the boundary of the space that is closest to each point.

Observe the points to which the arrows point as an example. All space within the two polygons that surround these two points is closer to their point than to the points on the other side of the border.
Voronoi polygons
When you have the Voronoi polygons, connect the points that have adjacent borders. This creates the TIN with fat triangles.Delaunay triangles

I said that TIN was useful, but Voronoi polygons are useful in themselves. For example, imagine that you own a group of grocery stores in a city and that you want to advertise to the community. You could calculate the Voronoi polygons around your stores and direct your customers to the store within each polygon. You would get more customers, and the customers would not know that they are within your Voronoi polygon.

Okay, so most of us will not own a group of grocery stores, how about something more useful? One of the first applications of Voronoi polygons was by John Snow in 1854 during the Broad Street cholera outbreak. Snow created what we now call Voroni polygons around water pumps and demonstrated that most cholera deaths occurred within the area of one water pump. That was just the first of many uses of Voronoi polygons.

Google Circles and PostGIS Circles

When the user draws a circle on the map and then clicks Get Draw Report, a report appears in a dialog that shows the NEPP seminars that have taken place within the area of the circle. How does this magic happen?
Google circle and Draw Report

The first thing to understand is that there are two softwares combining with each other here, Google Maps and the PostGIS extension of the PostgreSQL database, and that they don’t automatically know about each other. This is different than the Microsoft environment where softwares are connected to each other and thus “know” about each other. This may seem like a good thing, but in reality it causes complexity that often causes problems with the softwares.

For example, recently at the my place of work an install of SQL Server 2008 Management Studio caused Visual Studio 2008 to fail. We then installed Managment Studio on a virtual machine where there was no other Microsoft software, and the software worked as it should. Having softwares “know” about each other violates the OO principles of “loose coupling” and “tight cohesion”. Software functions best when it is independent of other software.

In this case, Google Maps must expose enough information about its circle so that PostGIS can recreate the circle and query the database for those seminars that fall within the circle. Google Maps exposes two facts about its circle, the radius of the circle and the center point. Having those two facts, the browser uses the Google geometry library to also find the four points to the north, south, east, and west of the radius of the circle:

spherical = google.maps.geometry.spherical;
center = selectedShape.getCenter();
radius = selectedShape.getRadius();
north = spherical.computeOffset(center, radius, 0);
east = spherical.computeOffset(center, radius, 90);
south = spherical.computeOffset(center, radius, 180);
west = spherical.computeOffset(center,radius,270);

The browser now performs an AJAX query and sends these four points to the server side PHP program. PHP uses these four points to construct a spatial query to the database. The WHERE clause of the query illustrates the complex spatial operations of which PostGIS is capable:

WHERE 
ST_WITHIN
(
  geometry,
  ST_MAKEPOLYGON
  (
    ST_CURVETOLINE
    (
      ST_GEOMFROMTEXT
      (
       'SRID=4326;
        CIRCULARSTRING
        (
           -123.1199 49.2662, 
           -123.1098 49.2727, 
           -123.0998 49.2662, 
           -123.1098 49.2596,  
           -123.1199 49.2662
        ) – end CIRCULARSTRING
      ') -- end ST_GEOMFROMTEXT
    ) -- end ST_CURVETOLINE
  ) -- end ST_MAKEPOLYGON
) -- end ST_WITHIN

This query first creates a CIRCULARSTRING, which is a curved string that begins and ends on the same point. The CIRCULARSTRING acts as input to ST_GEOMFROMTEXT, which makes a valid geometry object, using the spatial reference id (SRID) for WGS84, which is what Google Maps uses.

The geometry object then acts as input to ST_CURVETOLINE. This function converts a CIRCULARSTRING to a valid polygon, with a default value of 128 segments. This is because PostGIS does not actually do a spatial query with a circle, but rather with an approximation of a circle.

Finally the polygon acts as input to ST_WITHIN, which PostGIS uses to retrieve features within the polygon.

PHP retrieves the results of the spatial query, formats it as an HTML table and sends it back to the browser. The browser invokes a jQuery dialog and outputs the HTML table to the dialog.

In conclusion a Google circle is not the same as a PostGIS circle. These two softwares are independent of each other, but must be able to communicate in a non-partisan way to all other softwares. This they do extremely well.

Let the Map Speak for Itself

A map can show the location of something, but it can do much more. By adding suitable graphics and theming an attribute, a map can convey contextual information about something besides its physical location. In this case you can reduce the text that you add beside the map, and let the map speak for itself.

The map at the right is such a case. However, because I am explaining this concept, I’m going to speak for the map. 🙂 The main component of the map is the Elevation layer, which shows the elevation for 8 km beside the map. The map also has callouts that describe events in cities along the Elbe. Finally, the map has a table that shows the elevation of the cities on the map. Yes, you are allowed to put a table on a map.

The result is a map that is more than just the location of the Elbe. in fact, it communicates information that a newspaper cannot (unless the newspaper has a map). It shows that cities along the Elbe have challenges in the area of flood, because their elevation is so low.

You can see the full map by clicking the image. Oh well, here is a link to the map too.